Plotting impedance of individual modes

RF Engineer
RF Engineer New Altair Community Member
edited October 2020 in Community Q&A

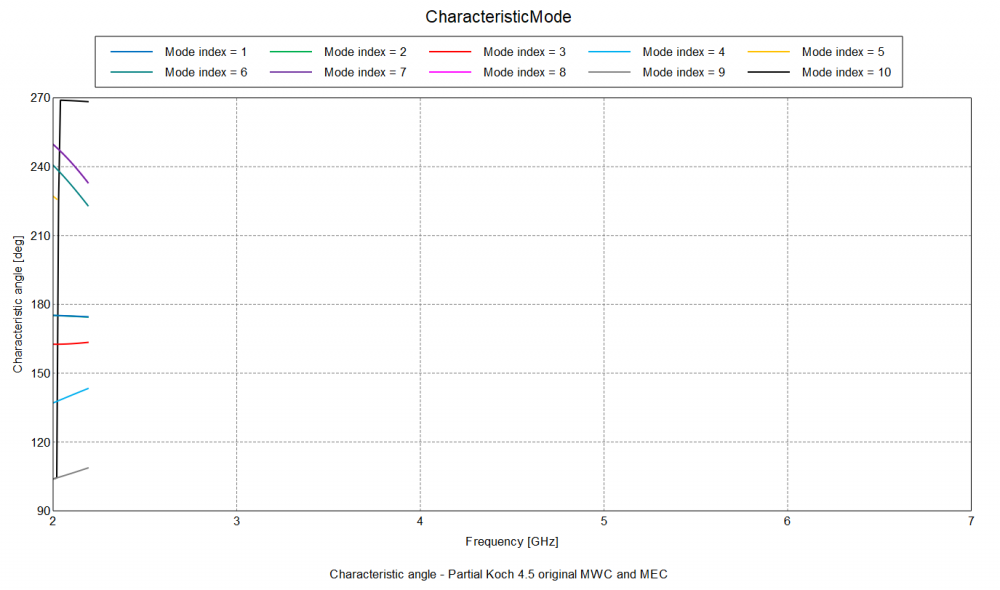
Hi!  I want to plot impedance of every mode individually and then total impedance of all modes to see the Resonance and Anti-Resonance points of my antenna. How to plot it? Also I am getting sudden peaks of few modes in CMA, while plotting these modes in HFSS and CST CMA tools I am getting smooth results but not in FEKO.

<?xml version="1.0" encoding="UTF-8"?>Results.png
Tagged:

Answers

  • Altair Forum User
    Altair Forum User
    Altair Employee
    edited December 2018

    Hello @RF Engineer


    You can see the modal resonances using any of the CMA parameters: a mode is resonant when MS (modal significance)=1, EV (Eigenvalue) =0 or CA (characteristic angle) = 0.

    Furthermore, if you have a source in your model, the MWC (modal weighting coefficent) will also be calculated, which indicates the overall modal presence achieved by the exception.


    For more detail please watch some of the older CMA webinars that are available on our resource library:


    https://altairhyperworks.com/ResourceLibrary.aspx?keywords=CMA&amp;altair_products=FEKO


  • RF Engineer
    RF Engineer New Altair Community Member
    edited December 2018

    Thank you so much for the response, I want to observe them in Impedance plot, let me attach a graph

    <?xml version="1.0" encoding="UTF-8"?>Resonance.png

  • Wilco Strydom
    Wilco Strydom New Altair Community Member
    edited December 2018

    If you are running a model with a source data you will also be able to plot modal source data such as impedance and reflection coefficients.

  • RF Engineer
    RF Engineer New Altair Community Member
    edited December 2018

    Thanks for answering, let me see it