Regarding tensile test simulation

Altair Forum User
Altair Forum User
Altair Employee
edited November 2020 in Community Q&A

Dear all,

I am want to simulate a tensile test experiment. Although I have simulated with the help of a video on youtube, but in my simulation I am getting some unusual results which generally not happened in my previous attempts.

I had attached the .hm and .h3d file. I am using HyperWorks v12.0 for my analysis.


Initially it shows good results because in actual experiments my specimen have fractured in same area where it shows in simulation.56df071841ee5_e8result.jpg.086ce5082bdbe
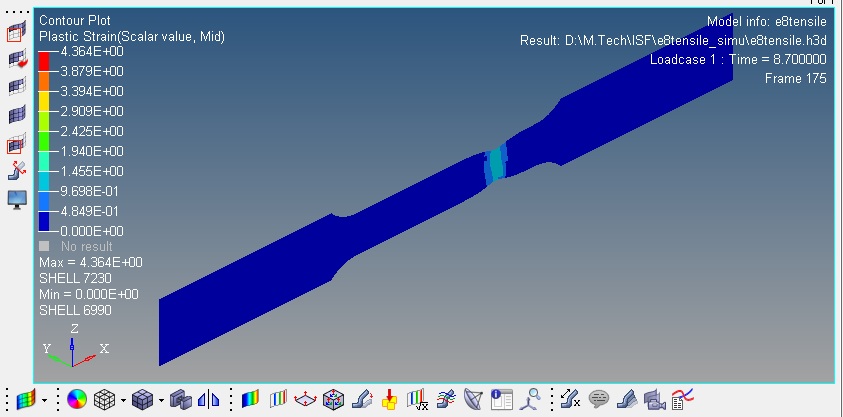


But after some time it show very unusual deformation.e8result1.jpg.228790a19ce91241ff66ded5d9
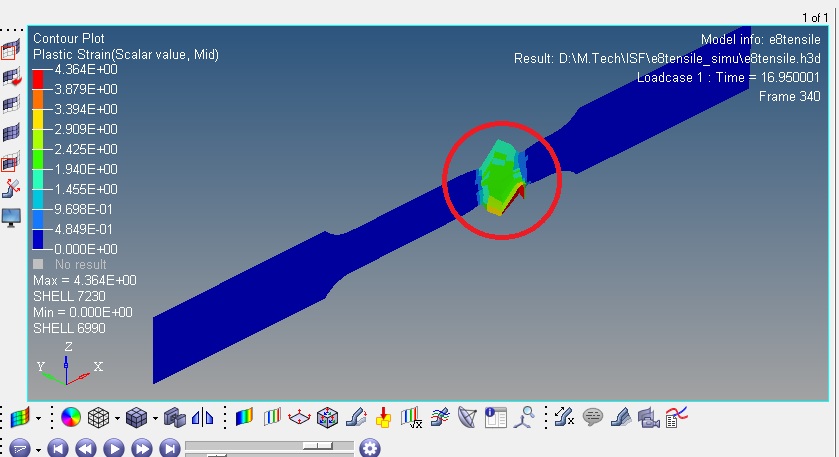
 

Please check my model and suggest me if I have done some thing wrong in this model.

Unable to find an attachment - read this blog

Tagged:
«1

Answers

  • Altair Forum User
    Altair Forum User
    Altair Employee
    edited March 2016

    Is this problem related to material properties?

    In this model I had used MAT/LAW2 Johnson-cook material model.

    Please reply to this.

  • Altair Forum User
    Altair Forum User
    Altair Employee
    edited March 2016

    Hi Abhishek, 


    I am simulating your model on RADIOSS.


    I will get back to you soon.

  • Altair Forum User
    Altair Forum User
    Altair Employee
    edited March 2016

    Hii Prakash,

    Thank you for your reply.

    I just wanted to know which version of HyperWorks you are using for simulation. Because I am using HyperWorks v12.


    Thanks and regards,

    Abhishek Kumar

  • Altair Forum User
    Altair Forum User
    Altair Employee
    edited March 2016

    Hi Abhishek,


    Here is my result from HW 13.0. Change the shell element formulation to type 24 in PROP/SHELL and try again.

    <?xml version="1.0" encoding="UTF-8"?>ToForum.gif

  • Altair Forum User
    Altair Forum User
    Altair Employee
    edited March 2016

    Hii Prakash,

    Thanks for your reply and your support.

    1. Can you explain the difference between the previous shell element formulation and the shell element formulation type 24?
    2. In this simulation it is not showing fracture after necking, it should fracture after necking. How I can get fracture in simulation?

    Thanks and Regards,

    Abhishek Kumar

  • Altair Forum User
    Altair Forum User
    Altair Employee
    edited March 2016

    Abhishek,


    Refer to th help regardinf different element formulations available. Here is some description about QEPH formulation.


    You may have to introduce the failure model to simulate fracture. Refer to /FAIL in RADIOSS help.

    <?xml version="1.0" encoding="UTF-8"?>Capture.JPG

  • Altair Forum User
    Altair Forum User
    Altair Employee
    edited March 2016

    Thnaks Prakash.

    Can you tell me about MTA LAW36, will it show fracture without failure model?

    I am simulating another model with MAT LAW36.


    Thanks and Regards,

    Abhishek

  • Altair Forum User
    Altair Forum User
    Altair Employee
    edited March 2016

    LAW 36 is piece wise non linear material model where you can give the stress strain values in the form of a curve.


    Have you tried with /FAIL/XFEM_JOHNS

  • Altair Forum User
    Altair Forum User
    Altair Employee
    edited March 2016

    No I have not tried FAIL/XFEM_JOHNS. I just checkd this, but it shows only FAIL>XFEM not XFEM_JOHNS.


    Thanks and Regards,

    Abhishek

  • Altair Forum User
    Altair Forum User
    Altair Employee
    edited March 2016

    Ok I just checked RADIOSS Manual. In this model we need to give values of D1,D2 and D3. But at present I don't have theses values for the material which I am simulating.This failure model is based on stress triaxiality and failure strain.For D1,D2 and D3 we need to plot a graph between failure strain and stress triaxiality.

    But problem is that I am simulating tensile test simulation to get the value of stress triaxiality for different of specimen under different failure mode. So that I can get the values of stress triaxiality at failure strain.. Then only I can get the value of D1,D2 and D3.

    Is there any other method to get the value of stress triaxiality at failure strain?


    Thanks and regards,

    Abhishek

  • Altair Forum User
    Altair Forum User
    Altair Employee
    edited March 2016

    Hiii Prakash,

    How I can evaluate my tensile test simulation results with experimental results? It means I want to compare the graph  (force vs. displacement or stress vs. strain) of simulation to actual experimental results.


    Thanks and Regards,

    Abhishek

  • Altair Forum User
    Altair Forum User
    Altair Employee
    edited November 2020

    Abhishek,


    here is a video which shows on how to plot for Stress Vs Strain in HyperGraph.


    Similarly you can do the same for Force Vs Displacement. 


    Before that, you need to create output blocks for elements to write stress and strain results to T01 file.


    Please refer to TH/SHELL for more information.

    Unable to find an attachment - read this blog

  • Altair Forum User
    Altair Forum User
    Altair Employee
    edited March 2016

    Thanks Prakash,

    I will try your suggestions.

    In actual tensile test experiment specimen breaks after 4-5 mm extension. So I wanted to know that can I simulate the experiment until this point only?Also how I can ensure that the displacement results in simulation are in mm and force results are in Newton. Please tell me about units of the material data which I should follow. Presently I am using following data for MATLAW 2-


    Density of material- 2.7 kg/m^3

    Elastic constant- 69000 MPa

    a = 58.73 MPa

    b = 83.81 MPa

    n = 0.1382 

    eps_max = 5.711

    sigma_max 112.65 MPa


  • Altair Forum User
    Altair Forum User
    Altair Employee
    edited November 2020

    Hiii,


    I was trying to simulate another tensile test.But the result was totally unexpected. I don't know what was the error in my model.

    This is the result.

    Untitled.png.1a87343b2fccabedac053f3cd55


    Meshing-

    <?xml version="1.0" encoding="UTF-8"?>Untitled1.thumb.png.2dee99e04a3c487f6177


    <?xml version="1.0" encoding="UTF-8"?>Untitled3.thumb.png.47921bbf0a1375ddd9e9


    Please find the .hm and .h3d files.


    Unable to find an attachment - read this blog

  • Altair Forum User
    Altair Forum User
    Altair Employee
    edited March 2016

    Abhishek,


    Check for nodal connectivity.


    Go to Edges panel (Shift+F3)>> Select all elements>> Preview Equiv>> if there are any free nodes FIx them using>> Equivalence.

  • Altair Forum User
    Altair Forum User
    Altair Employee
    edited March 2016

    In actual tensile test experiment specimen breaks after 4-5 mm extension. So I wanted to know that can I simulate the experiment until this point only?

    Abhishek,


    You can use /SENSOR with type as DIST which works for nodal distance.


    Please refer to help for more information.

  • Altair Forum User
    Altair Forum User
    Altair Employee
    edited March 2016

    Please tell me about units of the material data which I should follow. Presently I am using following data for MATLAW 2-


    Type of units that have to be used is specified in help and this may vary for different material models. For LAW 2 here is the unit system:

    <?xml version="1.0" encoding="UTF-8"?>Capture.JPG

  • Altair Forum User
    Altair Forum User
    Altair Employee
    edited March 2016

    Thank you Prakash.

  • Altair Forum User
    Altair Forum User
    Altair Employee
    edited March 2016

    Dear Prakash,

    Thanks for your continuous support.


    I just checked the SENSOR/DIAS in RADIOSS manual. Can you suggest me how to edit the card image? I mean what values should I input to card image.

    Should I use-

    Tdelay- 0

    node1- any node at fixed end.

    node2- any node at velocity end.

    Dmin- 0

    Dmax- 0.006m (if I want to stop at 6mm displacement)


    After that should I also edit engine file to stop the simulation at this prescribed displacement?


    Thanks and regards,

    Abhishek


  • Altair Forum User
    Altair Forum User
    Altair Employee
    edited March 2016

    Abhishek

    After that should I also edit engine file to stop the simulation at this prescribed displacement?


    Yes, you need to add the /STOP/LSENSOR to stop the analysis when the sensor activates. Please refer to STOP/LSENSOR.

  • Altair Forum User
    Altair Forum User
    Altair Employee
    edited November 2020

    Abhishek,


    here is a video which shows on how to plot for Stress Vs Strain in HyperGraph.


    Similarly you can do the same for Force Vs Displacement. 


    Before that, you need to create output blocks for elements to write stress and strain results to T01 file.


    Please refer to TH/SHELL for more information.


    Hii prakash,

    Please find the attached pdf. In this example a comparison has been done between experimental results and simulated results. Same comparison I want to perform in my study.    

    Unable to find an attachment - read this blog

  • Altair Forum User
    Altair Forum User
    Altair Employee
    edited November 2020

    Hii,

    I have simulated the tensile test experiment but the values of force which I am getting in simulation is very less compared to real time experiment. In simulated result I am getting max. force around 120 N but in experiment it is around 2660 N. Please check attached results and model. I have also attached the results of real time experiment.


    Thanks and regards,

    Abhishek 


    Unable to find an attachment - read this blog

  • Altair Forum User
    Altair Forum User
    Altair Employee
    edited November 2020

    Dear Sir, 

    I tried to plot the stress strain curve for tensile test simulation carried out by me. But, I was unable to do it, the .hm  is attached below.


    Please plot the stress vs strain curve and also explain how to plot it.


    Thanks and Regards

    Pavan Kumar


    Unable to find an attachment - read this blog

  • Altair Forum User
    Altair Forum User
    Altair Employee
    edited November 2020

    Hi Pavan Kumar,
    You can output Stress and strain creating Output Blocks in RADIOSS.

    Go to Analaysis page>> Output Block>> elements. Card edit the created output block and change the variable to DEF for default outputs. Please go through /TH/SHEL in the Help Menu for more information about the output variables.

    This video https://www.youtube.com/watch?v=1BnhOzRVkEQ&list=PLQ7KUGFuVz4u5y3SvIEIU07427-gATaG6&index=6 is a webinar showing creating output blocks in RADIOSS.


    The other way is plot stress and plastic strain from HyperView.

    Output Stress and strain through control cards and contour stress. Go to Plot curves and plot Stress Vs time. Similarly do the same for strain in the same existing window and do a cross plot in HyperGraph.

    The attached document shows the steps to perform a cross plot in HyperGraph.

    Unable to find an attachment - read this blog

  • Altair Forum User
    Altair Forum User
    Altair Employee
    edited November 2017

    Ok I just checked RADIOSS Manual. In this model we need to give values of D1,D2 and D3. But at present I don't have theses values for the material which I am simulating.This failure model is based on stress triaxiality and failure strain.For D1,D2 and D3 we need to plot a graph between failure strain and stress triaxiality.

    But problem is that I am simulating tensile test simulation to get the value of stress triaxiality for different of specimen under different failure mode. So that I can get the values of stress triaxiality at failure strain.. Then only I can get the value of D1,D2 and D3.

    Is there any other method to get the value of stress triaxiality at failure strain?


    Thanks and regards,

    Abhishek

    How to find triaxility?

  • Altair Forum User
    Altair Forum User
    Altair Employee
    edited November 2017

    Hi Pavan Kumar,

    Stress triaxiality is an important and useful character to describe the state of stress, which effects the material damage and fracture.

    In /FAIL/JOHNSON card D1, D2, and D3 are constants in the Johnson failure equation that relates plastic failure strain to stress triaxiality. 

    Please go through the RADIOSS User Guide in Help Menu where this concept is described in /FAIL/JOHNSON card (page 124 onwards).

    The following are some common stress states and their triaxiality values:


    tri1.PNG

  • Altair Forum User
    Altair Forum User
    Altair Employee
    edited November 2020

    Hello Sir,

    I had carried out the simulation with specimen having different shape then doge bone specimen. I am unable to get the exact stress strain curve and force vs displacement plot also . I had created the output block with the elements section. I am attaching .hm, .h3d and T01 file with this, please explain me where I am doing mistake.

    Unable to find an attachment - read this blog

  • Altair Forum User
    Altair Forum User
    Altair Employee
    edited November 2020

    Hello Pavan,

    From the T01 file select the element for plotting the stress and strain curve. Else, from HyperView also you can plot this using Build Plots menu.

    Once these plots are done using cross plot option you can create stress-strain curve.

    I'm attaching two documents where cross plotting is shown. Please follow the steps shown in these documents to create a cross plot.

    Unable to find an attachment - read this blog

  • Altair Forum User
    Altair Forum User
    Altair Employee
    edited November 2017

    Thank you for the reply Sir,

    I have already used the cross plot and getting the stress vs strain in one plot. I have also used the T01 file in Hypergraph for plotting this for an specified element. However the trend of the stress strain curve is not appropriate, Therefore I am requesting you please see my .hm file,  h3d and T01 file and explain me is there any mistake in modelling. I am attaching the stress strain curve plotted using cross plot but the trend of the curve is not appropriate. pleas e see the attachment.

    <?xml version="1.0" encoding="UTF-8"?>stress vs strain.png

  • Rahul Rajan_21763
    Rahul Rajan_21763 New Altair Community Member
    edited November 2017

    We are working on your query.We will get back to you soon.