The Siemens Community Catalyst program was co-created with our community to acknowledge technology leaders who consistently contribute to the Siemens Community. Nominations are accepted on a rolling basis.
HV gives option for viewing each CPRESS ( for each interaction in abaqus ) individually. But i want to view all CPRESS output at the same time (like viewing in abaqus). How to do that ?
Hi,
Do you want to see the contour values with respect to the increment?
in such case, change the legend type to Dynamic scale.
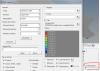
In contour panel>> Edit legend>> change legend type to Dynamic scale and click OK.
Now,play the animation.
<?xml version="1.0" encoding="UTF-8"?>
No. My doubt is,
I have 3 different contact areas (3 Slaves + 3 Masters in three different locations) in a given assembly at a time.
I solve it in abaqus. and view in HV.
While viewing contact stress results, HV gives option as
1.CPRESS ( Surface 1 & 2)
2.CPRESS ( Surface 3 & 4)
3.CPRESS ( Surface 5 & 6)
That means i can view only one contact stress distribution from the drop down menu at the given time.
But in abaqus using single card CPRESS i can view all three distribution at the same time.
I want to view the same way (all three distribution in a single contour plot) in HV.
ahilan,
You should be able to do this in 13.0, which version are you using?
Hi Rahul,
I have only access to hyperworks 12 in my Lab.
Will the feature be available in Hyperworks 13 student edition. (if yes will i be able to open a model with more than 10000 nodes in hyperview student edition ?).
The student edition is limited to 10,000 nodes.