The Siemens Community Catalyst program was co-created with our community to acknowledge technology leaders who consistently contribute to the Siemens Community. Nominations are accepted on a rolling basis.
Hi,
I want to plot result of deflection of cantilever beam with respect to distance from fixed point. So, how to plot graph of deflection result. please reply.
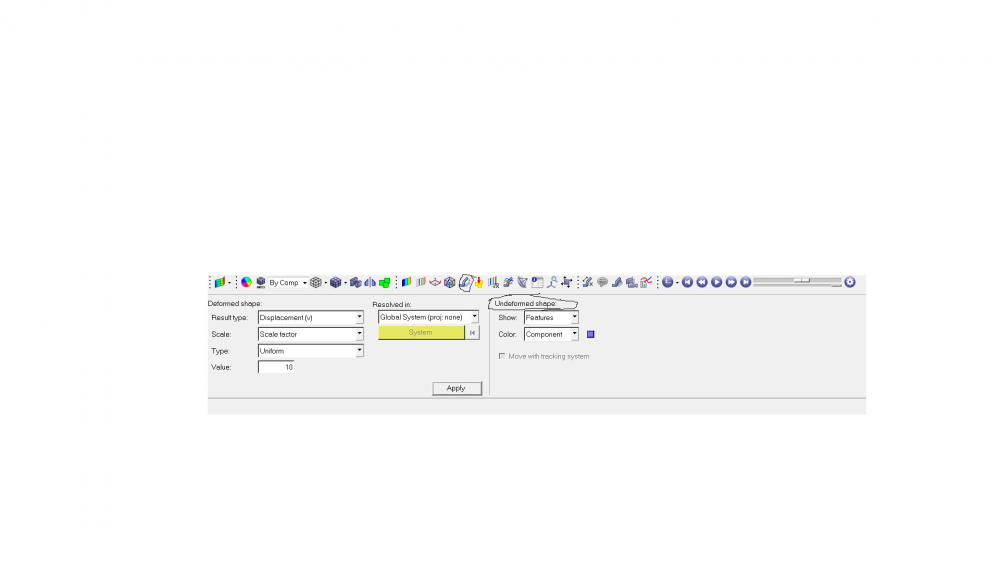
Use deformed option with edges or wireframe.See attached screenshot.
<?xml version="1.0" encoding="UTF-8"?>
Thanks for information rahul. But, can I find out result at each definite distance.
I am not clear about your requirement.Did you try with measure option.
Dear rahul sir,
Can you provide tcl\tk script to set deformed -> value
thanks in advance.
Vikas Kumar
8509012124
Query resolved in below post.
Join us for a community conversation on how High-Performance Computing (HPC) and Simcenter PSIM work together to meet the increasing demands of modern power electronics simulation. During this one-hour technical session, you'll discover how leveraging HPC can speed up simulations, improve scalability, and empower engineers…
Join us for a community conversation on accelerating your motor simulation workflow with Simcenter Simlab. In this beginner-friendly session, we'll introduce the platform's automated model-building capabilities and show how easy it is to set up your first electric motor analysis. You'll see the basic steps of geometry…
Join us for a Community Conversation where we'll discuss practical approaches to analyzing complex electromagnetic models using hybrid solver techniques. This session will provide a general overview of how different computational methods can be combined within a single simulation to address models containing varied…