plot and text setting


Hello All,
Pleas see the attached picture.
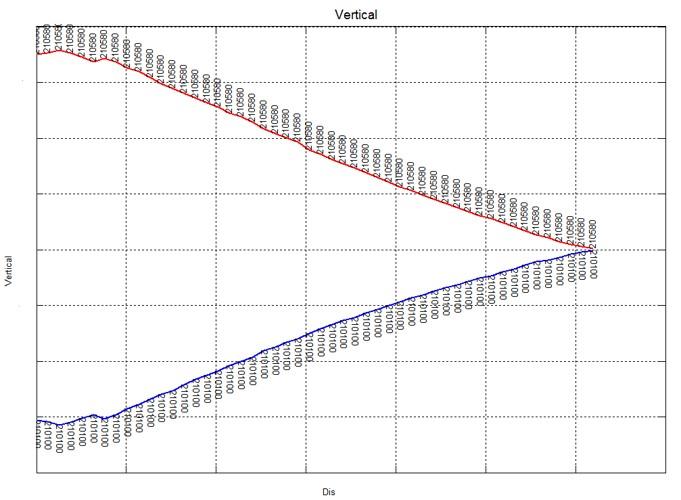
[fig1.jpg]
- It is a Compose results
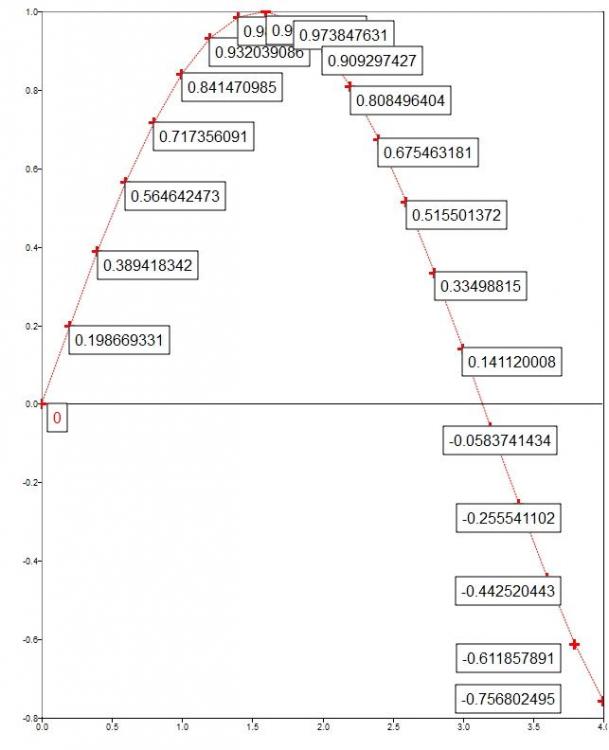
[fig2.jpg]
- It is a what I want to make.
How can I plot this graph? (Compose Ver. 2017.3); Please see the text box
1. without the border line. transparent border line
2. text rotation
3. the background color of text box is transparent .
[fig1.jpg]
<?xml version="1.0" encoding="UTF-8"?>
[fig2.jpg]


I attached the oml test file.
how can I make the graph according to my purpose; like the upper fig2.jpg
- without the border line. transparent border line
- text rotation
- the background color of text box is transparent .
My attached oml file results is like this.
<?xml version="1.0" encoding="UTF-8"?>

SeokSan,
I'd go here with a Python bridge here using
import matplotlib.pyplot as plt
One way to remove all frames (transparent borders) would be:
fig, ax = plt.subplots()
ax.plot(range(10))
fig.patch.set_visible(False)
ax.axis('off')
To rotate the text inside your plot:
def addtext(ax, props):
ax.text(0.5, 0.5, 'text 0', props, rotation=0)
ax.text(1.5, 0.5, 'text 45', props, rotation=45)
ax.text(2.5, 0.5, 'text 135', props, rotation=135)
ax.text(3.5, 0.5, 'text 225', props, rotation=225)
ax.text(4.5, 0.5, 'text -45', props, rotation=-45)
Each command above rotates in a certain angle.
Regards,
Roberta


Thank you Roberta,
Does Compose have a plan to add this functions?


Yes Seoksan, Currently development team are working on it as we speak.
Manoj kandukuri
SeokSan,
Text's properties: children (read only): Child objects of the line. color: Color of the text. fontangle: Font angle of the text, either regular or italic. fontname: Font family of the text. fontsize: Font size of the text. fontweight: Font weight of the text, either normal or bold. handle (read only): Handle of the text; parent (read only): Handle of the parent of the line. string: Displayed text. type (read only): Type of the graphics object, which is always 'text'. visible: Visibility of the text.
Best Regards,
Ronald