The Siemens Community Catalyst program was co-created with our community to acknowledge technology leaders who consistently contribute to the Siemens Community. Nominations are accepted on a rolling basis.
How do I plot an amplitude vs. frequency graph with the results generated in Inspire Motion from a sine-sweep actuator?
I can export the displacement results vs time but I'm not sure if performing an FFT on it will give me what I want?
Hello,
When simulation results are available: 1. Mouse click on a part or feature in the graphics area OR Click on a feature name in the browser
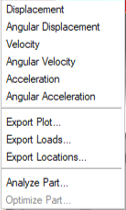
2. Right-mouse click on a displayed plot to access other plot types 3. Several types of plot results can be exported to *.csv files
To choose what to see in the graph right click on the plot and you should see the options available as shown below.
Thankyou