The Siemens Community Catalyst program was co-created with our community to acknowledge technology leaders who consistently contribute to the Siemens Community. Nominations are accepted on a rolling basis.
Hello,
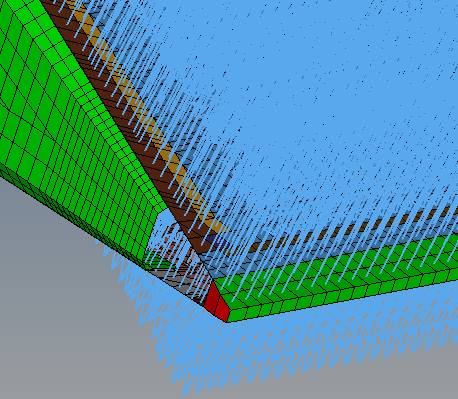
I'm searching to visualize the pressure load on my FEM. I don't want tosee the vector (as on attached image) but a colour for each element with a legend. How can I do?
Thanks,
Rino
<?xml version="1.0" encoding="UTF-8"?>
Try 'BCs' => 'Contour Loads'