Hello,
I did cartesian plot for my structure's near field and maximum field magnitude is around 80 V/m (please see the attached screenshot). When I exported the near field data, I noticed that field values are much smaller than what's plotted in Postfeko (1E-2 times smaller). I'm attaching the efe file and plot of z vs mag Ez using the data in it for your reference. These values should be same, but they are not. Can you please help me understand what Postfeko does when plotting near field on cartesian chart?
Thanks in advance,
<?xml version="1.0" encoding="UTF-8"?>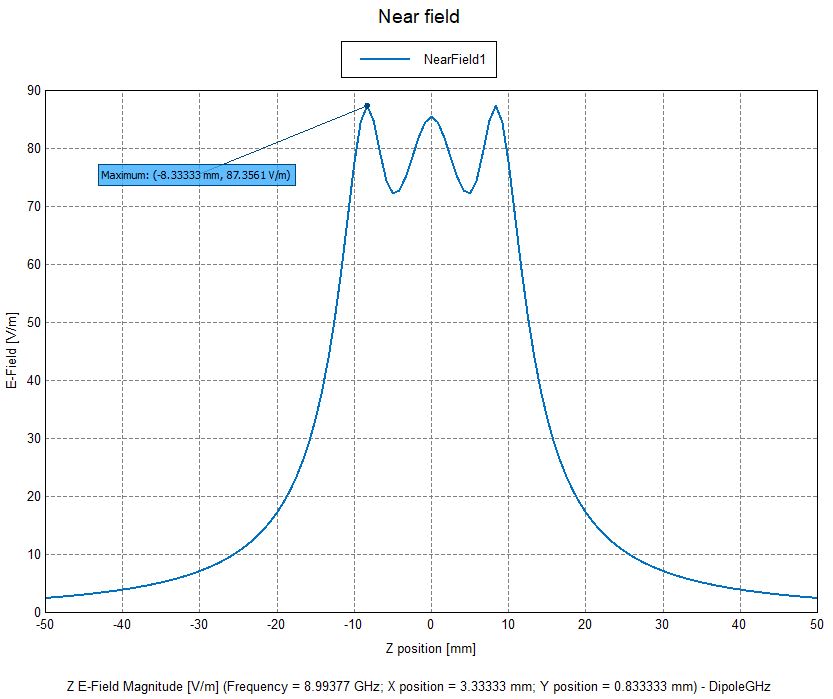
<?xml version="1.0" encoding="UTF-8"?>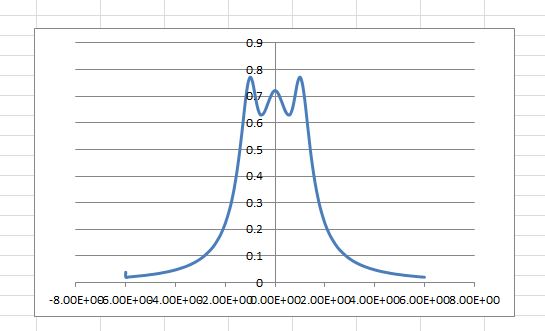
Unable to find an attachment - read this blog
