The Siemens Community Catalyst program was co-created with our community to acknowledge technology leaders who consistently contribute to the Siemens Community. Nominations are accepted on a rolling basis.
Hi All,
I need to plot contour of velocity RMS( 20-200 Hz) for modal frequency response analysis. What possible option do we get in hyperview to perform same.
Thanks and Regards,
Rohit Rai
Hi Rohit,
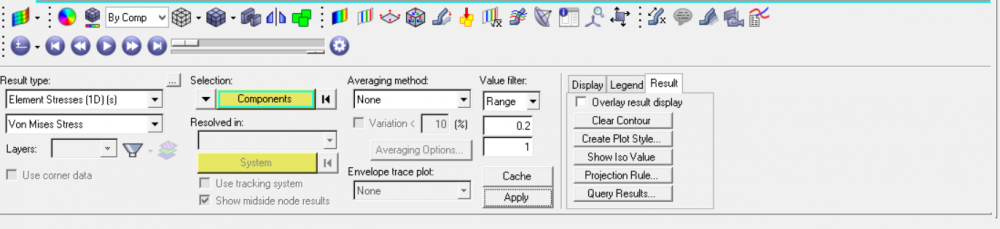
Can you check with the option Range while plotting?
<?xml version="1.0" encoding="UTF-8"?>