Hi,
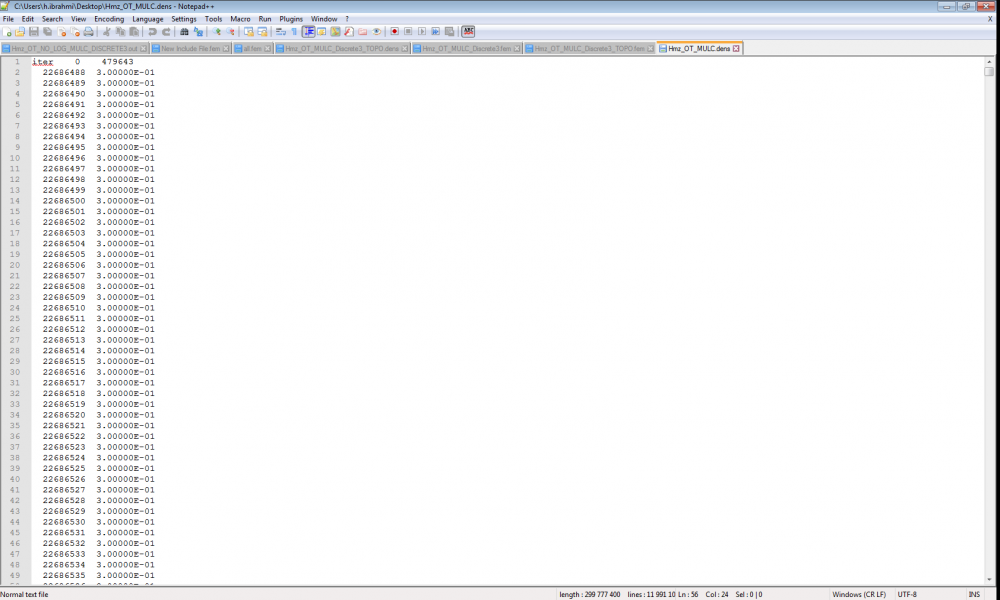
Please i used the Control Cards>> DENSITY>> FIle format>> TOPO to output density for elements of Design space for each iteration in file .DENS.
and i want now to plot a histogram that for that
for example for the iteration 0 i want to plot a histogram that shows the number of elemens that haves a density between 0.1 and 0.19, the number of elements that have density between [0.2 , 0.29]
number of elements that have density between [0.3 , 0.39 ] and going on until 1
Please how can i donig this ?
Thank you very much
<?xml version="1.0" encoding="UTF-8"?>