Plotting in Compose

Altair Forum User
Altair Forum User
Altair Employee
edited October 2020 in Community Q&A

Hello,


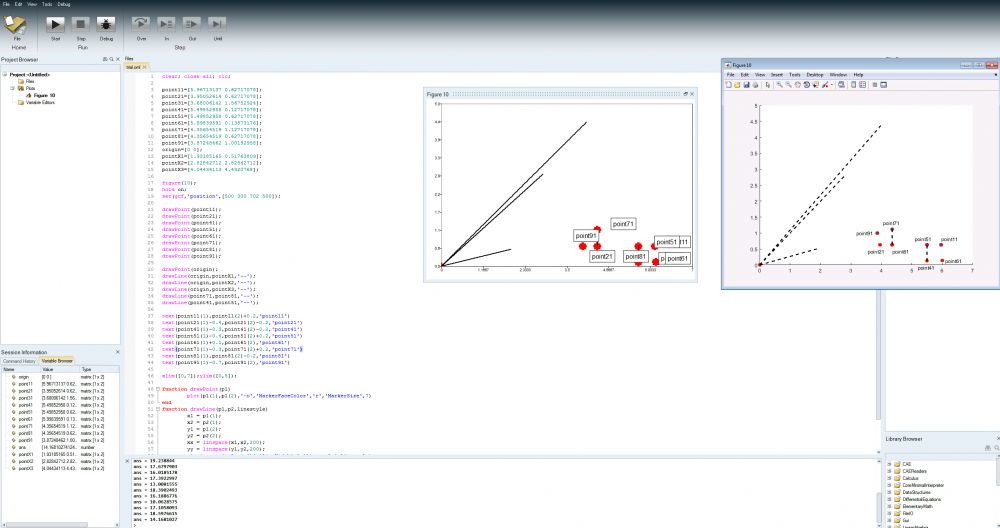
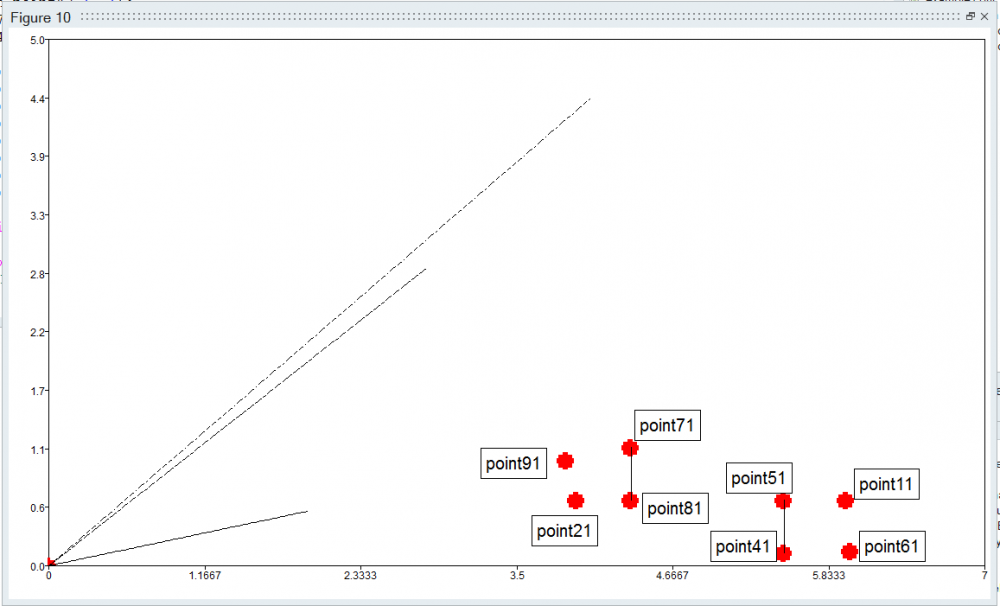
I have been working on plotting a figure in Compose, based on a code I originally created in MATLAB 2016a. Below please see the script. It has two simple functions which should be saved as individual files. When I run the same script in Compose and MATLAB, I get different results (please see the screenshot attached). For example, in Compose, the dash lines are not clear. Also, the location of the text is not the same. Is this related to the difference in the resolution between Compose and MATLAB? Could you please let me know if there are any parameters that I can adjust in the Compose (either in Preferences or in a command) to improve the figure? 


clear; close all; clc;

point11=[5.96713137 0.62717078];
point21=[3.95052614 0.62717078];
point31=[3.68006142 1.56752924];
point41=[5.49852958 0.12717078];
point51=[5.49852958 0.62717078];
point61=[5.99839591 0.13873176];
point71=[4.35654519 1.12717078];
point81=[4.35654519 0.62717078];
point91=[3.87248462 1.00192958];
origin=[0 0];
pointX1=[1.93185165 0.51763809];
pointX2=[2.82842712 2.82842712];
pointX3=[4.04434113 4.4320768];

figure(10);
hold on;
set(gcf,'position',[500 300 702 500]);

drawPoint(point11);
drawPoint(point21);
drawPoint(point41);
drawPoint(point51);
drawPoint(point61);
drawPoint(point71);
drawPoint(point81);
drawPoint(point91);

drawPoint(origin);
drawLine(origin,pointX1,'--');
drawLine(origin,pointX2,'--');
drawLine(origin,pointX3,'--');
drawLine(point71,point81,'--');
drawLine(point41,point51,'--');

text(point11(1),point11(2)+0.2,'point11')
text(point21(1)-0.4,point21(2)-0.2,'point21')
text(point41(1)-0.3,point41(2)-0.2,'point41')
text(point51(1)-0.4,point51(2)+0.2,'point51')
text(point61(1)+0.1,point61(2),'point61')
text(point71(1)-0.3,point71(2)+0.2,'point71')
text(point81(1),point81(2)-0.2,'point81')
text(point91(1)-0.7,point91(2),'point91')

xlim([0,7]);ylim([0,5]);

function drawPoint(p1)
        plot(p1(1),p1(2),'-o','MarkerFaceColor','r','MarkerSize',7)
end
function drawLine(p1,p2,linestyle)
        x1 = p1(1);
        x2 = p2(1);
        y1 = p1(2);
        y2 = p2(2);
        xx = linspace(x1,x2,200);
        yy = linspace(y1,y2,200);
        plot(xx,yy,'color','k','lineWidth',2,'linestyle',linestyle)
end


Thank you

Berker


<?xml version="1.0" encoding="UTF-8"?>Screen Shot 2018-04-26 at 4.30.34 PM.png

Tagged:

Answers

  • manoj kandukuri
    manoj kandukuri
    Altair Employee
    edited February 2021

    Hi Berker,

    1. Normalizing the resolution in set command should do the trick for making the dash lines more visible -- something like

                  'set(gcf,'units','normalized','position',[.300 .300 0.600 .700]);'

    and you can change the linewidth in combination to make it more clearer.


     2. The implementation of Text is little different, the text box starts from the X and Y coordinates, you can move the text box by adding or subtracting the X&Y arguments by a constant value in TEXT command. 

    like 
    text(point11(1)-0.8,point11(2)+0.2,'point11')
    text(point21(1)-0.85,point21(2)-0.2,'point21')
    text(point41(1)-1.25,point41(2)-0.1,'point41')
    text(point51(1)-1.15,point51(2)+0.25,'point51')
    text(point61(1)-0.8,point61(2),'point61')
    text(point71(1)-0.6,point71(2)+0.2,'point71')
    text(point81(1)-0.55,point81(2)-0.01,'point81')
    text(point91(1)-1.1,point91(2),'point91')


    Hope this helps.

    Thanks,

    Manoj 


    <?xml version="1.0" encoding="UTF-8"?>image.thumb.png.2cff1fa75c1bfc624732bd274835d916.png
     

  • Altair Forum User
    Altair Forum User
    Altair Employee
    edited April 2018

    Thank you, Manoj. This was very helpful. 


    I tried to adjust the font size of a text inside a figure using the a similar command from MATLAB, but it didn't work.

    text(point11(1),point11(2)+0.2,'point11','FontSize',10)


    Is FontSize property not available in text function?


    Kind Regards

    Berker

  • Altair Forum User
    Altair Forum User
    Altair Employee
    edited April 2018

    Also, could it be possible to remove the box around the text?


    Thank you

    Berker

  • RoKet
    RoKet
    Altair Employee
    edited May 2018

    Thank you, Manoj. This was very helpful. 


    I tried to adjust the font size of a text inside a figure using the a similar command from MATLAB, but it didn't work.

    text(point11(1),point11(2)+0.2,'point11','FontSize',10)


    Is FontSize property not available in text function?


    Kind Regards

    Berker


    see answer to this topic