Vortice Structure in AcuFieldView
Hello experts,
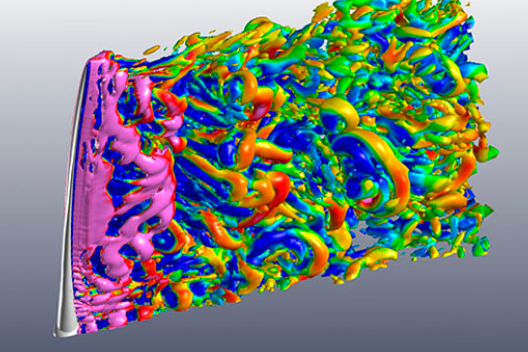
I have seen a lot of picture introduce about AcuSolve like the one below:

The picture shows something like vortices structure in the result.
Does anybody knows about how to post processing like that in AcuFieldView? Please guide me!
If AcuFieldView can not, which software can?
Also, in AcuFieldView/ FieldView, they provided a function called Q Criterion.

I couldn't find any document/user guide about how to use this function.
What do i need to input for this Q-criterion?

Thank you very much for your help!
Answers
-
The image does represent Q Criterion, colored by something like velocity magnitude or pressure. You should create in isosurface of Q Criterion, then select a value for Q Criterion that gives you the 'look' you want. In the function calculator, you would put the velocity function - the vector - inside the parenthesis.
0 -
very nice and clean answer.
Thank you very much!
0