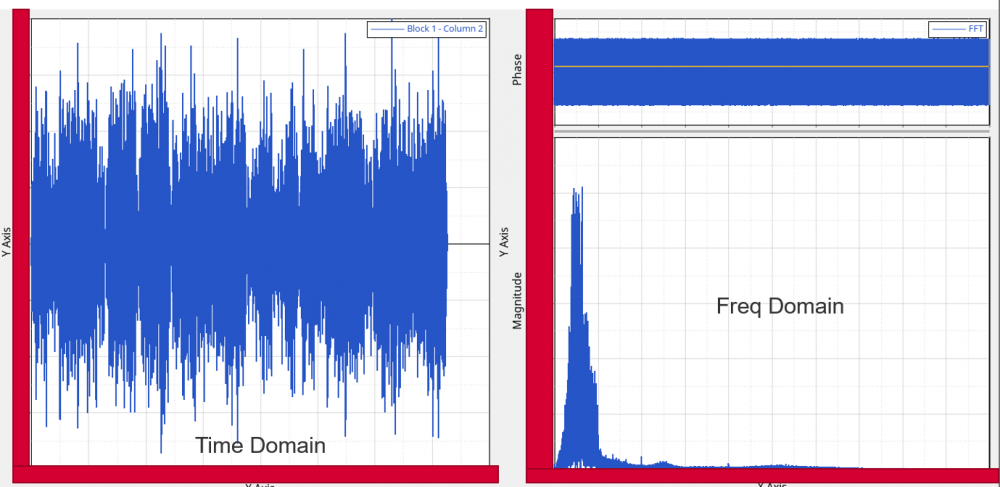
Magnitude & Phase output for FFT Function with Windowing
Hi all,
I have a time domain curve which I would like to convert into frequency domain.
By doing so I would like to obtain the magnitude and phase output from the curve.
I need the Windowing function as well. Something like what fft hanning does in HyperGraph.
Is there a similar function in Compose?
The output I need should have both Magnitude and Phase components, something like this:
Answers
-
Hello Debdatta,
you can use the user defined function (attached to this reply) with this syntax:
[AmpFFT,PhFFT,f] = FFTeval(s,Fs);
s: your signal values
Fs: sampling frequency
AmpFFT: apmlitude of the single sided spectrum
PhFFT: Phase of the single sided spectrum
f: frquency vector
you can then plot your results:
figure()
plot(f,AmpFFT)
figure()
plot(f,PhFFT)
Of course you can also apply windows to your signal. There are many built windows ready to be used.
Your script will be:
w = hann(numel(s),'periodic'); %window
s = s .* w; % windowing
[AmpFFT,PhFFT,f] = FFTeval(s,Fs);
Other windows you can use: hamming, kaiser, blackman... (just look inside the SignalProcessing library)
Hope it helps,
Lorenzo
0 -
Hi Debdatta,
You can use 'real' & 'angle' commands to get magnitude and phase of fft signal
real(ft)
angle(ft)thanks,
Manoj kandukuri
0
