Hi all,
I have a time domain curve which I would like to convert into frequency domain.
By doing so I would like to obtain the magnitude and phase output from the curve.
I need the Windowing function as well. Something like what fft hanning does in HyperGraph.
Is there a similar function in Compose?
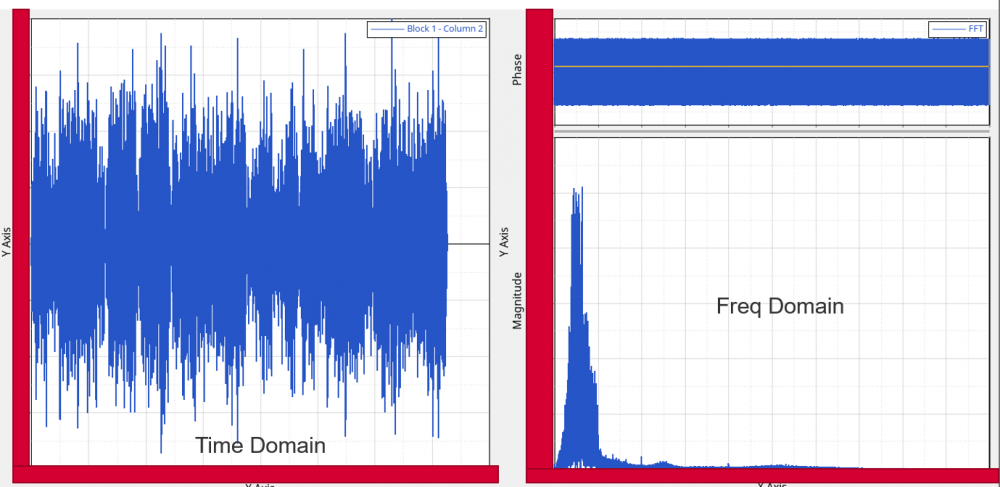
The output I need should have both Magnitude and Phase components, something like this:
<?xml version="1.0" encoding="UTF-8"?>