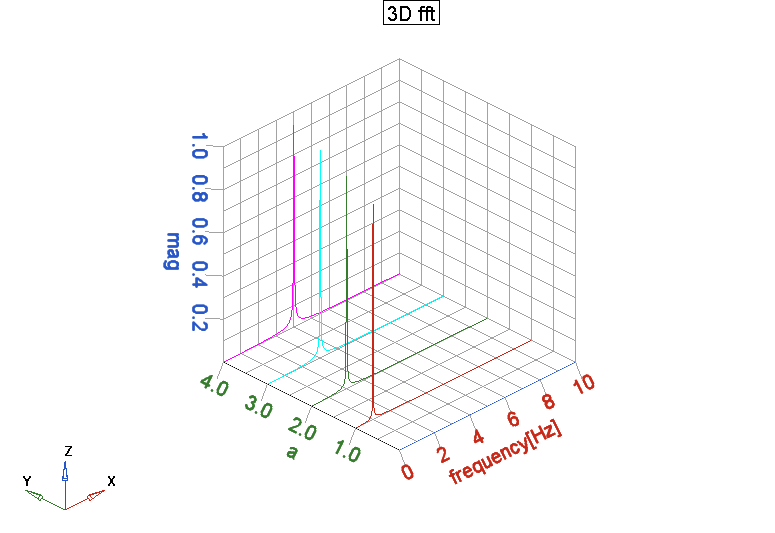
FFT 3D plot
Let's assume that there is a curve f(a, t) in time domain and we apply FFT to the function, assigning values to a (like a=a1, a2, a3, . . . ., an). Then, as a result we can get n FFT curves in frequency domain, F1(a1,f), F2(a2,f), F3(a3,f), . . . , Fn(an,f).
We want to plot those FFT curves in a 3D plot which has frequency as x axis, 'a' as y axis and FFT magnitude as z axis. Can it be done?
Of course yes!!!
This is what we get with the enclosed script:

Find more posts tagged with
No comments on this post.
